

Requires Admin permissions.
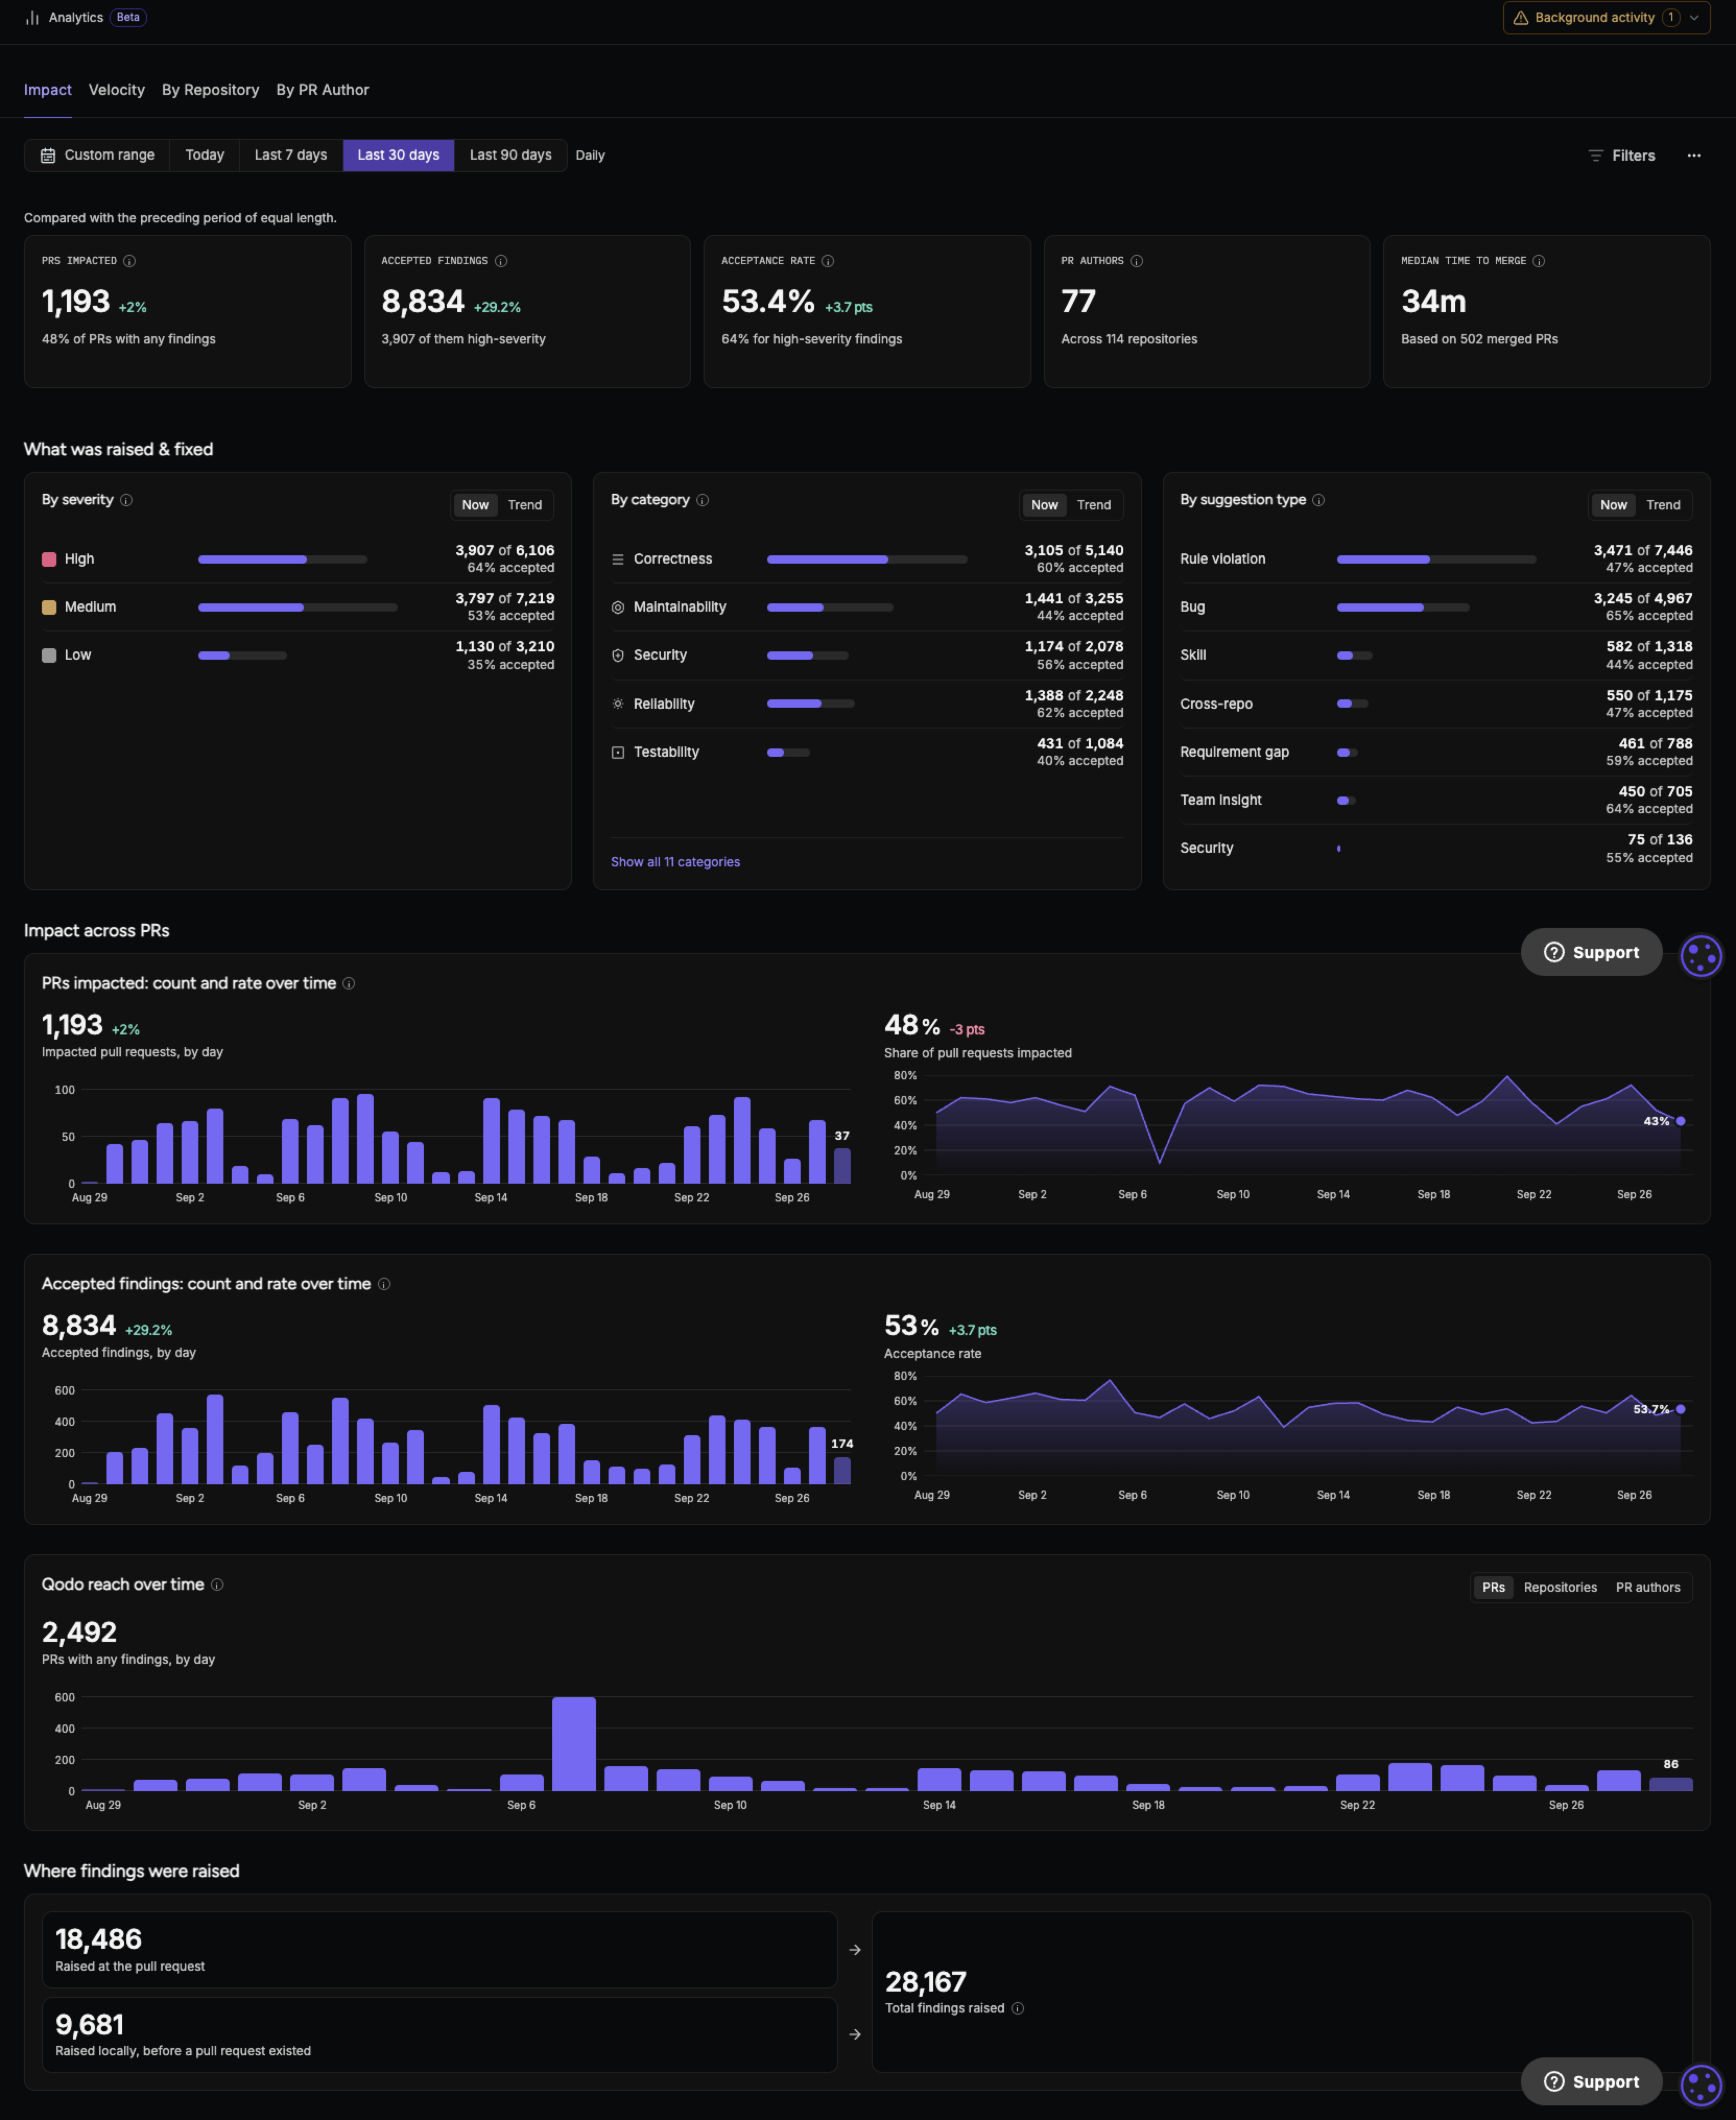
Filter analytics
You can filter analytics by:- Time range: Today, Last 7 days, Last 30 days, Last 90 days, or a custom range. The time range filters by when Qodo raised the finding. Today starts at midnight UTC. A custom range can cover up to 365 days.
- Severity: Low, Medium, High, or All levels.
- Category: Accessibility, Architecture, Compliance, Correctness, Maintainability, Observability, Performance, Quality, Reliability, Security, and Testability. For more information, see the Finding categories table.
- Type: Bug, Rule violation, Requirement gap, Team insight, Skill, Cross-repo, and Security.
- Bug: Logic errors, edge cases, and anti-patterns in the change.
- Rule violation: Code that breaks one of your organization’s rules.
- Requirement gap: The pull request does not fully implement a requirement from its linked ticket or specification.
- Team insight: A finding raised from a team profile, which reviews the pull request the way the most relevant teammates would.
- Skill: A finding raised by a skill defined in your repository.
- Cross-repo: A change that breaks code in a related repository.
- Security: A vulnerability in the change, such as an OWASP or CWE-class issue.
- Repository: One or more indexed repositories.
- PR author: One or more PR authors.
Finding categories
Understand analytics metrics
Analytics metrics are calculated from Qodo findings data. The dashboard counts findings raised on a pull request or linked to one. Local findings and findings detected after merge are excluded.Measure the impact of Qodo findings
The Impact view gives you an organization-wide view of how Qodo findings affect pull requests. Use it to understand how often findings lead to action, how many result in accepted code changes, and how broadly Qodo findings reach across your organization.Identify where findings have the most impact by repository
The By repository view breaks down finding activity by repository. Use it to understand how findings are acted on across repositories and where acceptance rates differ.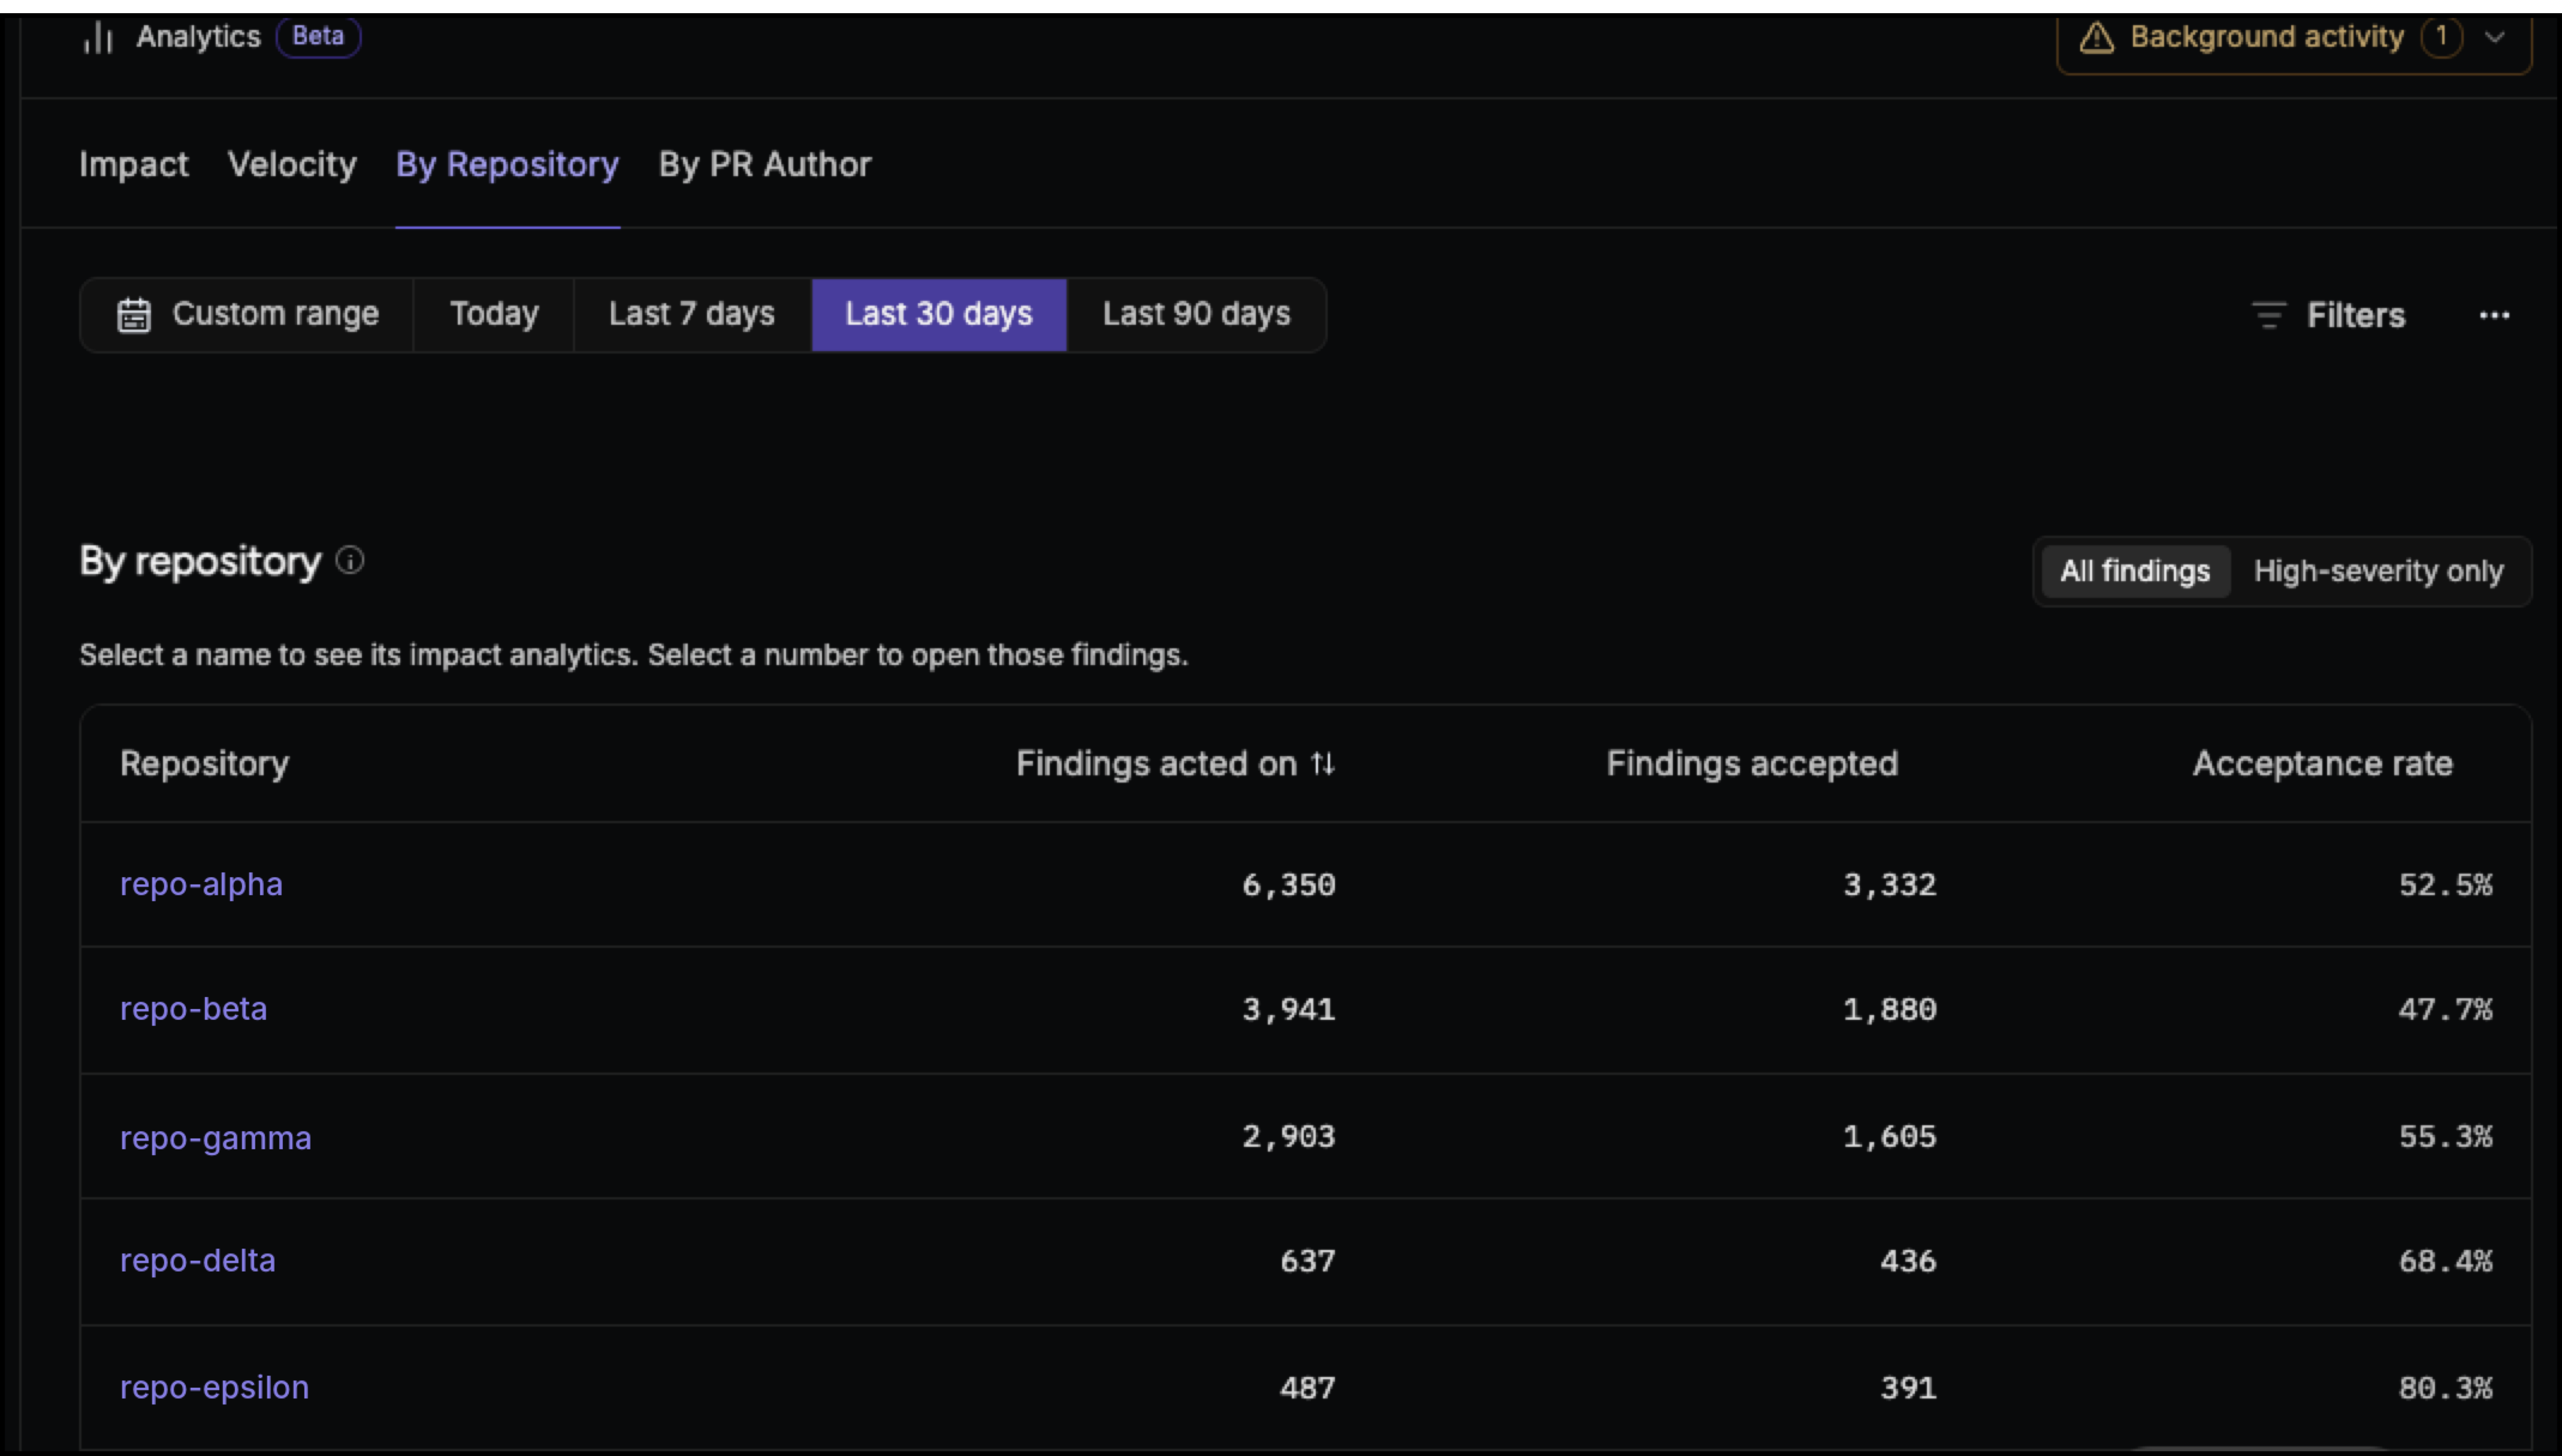
- Repository: The repository where findings were raised.
- Findings acted on: The number of findings with a final outcome: accepted, not accepted, or dismissed.
- Findings accepted: The number of findings that resulted in an accepted code change.
- Acceptance rate: The percentage of findings that were accepted.
Understand finding response by PR author
The By PR author view shows how authors respond to Qodo findings across their pull requests. Use it to understand response patterns, track changes over time, and identify findings that remain unaddressed.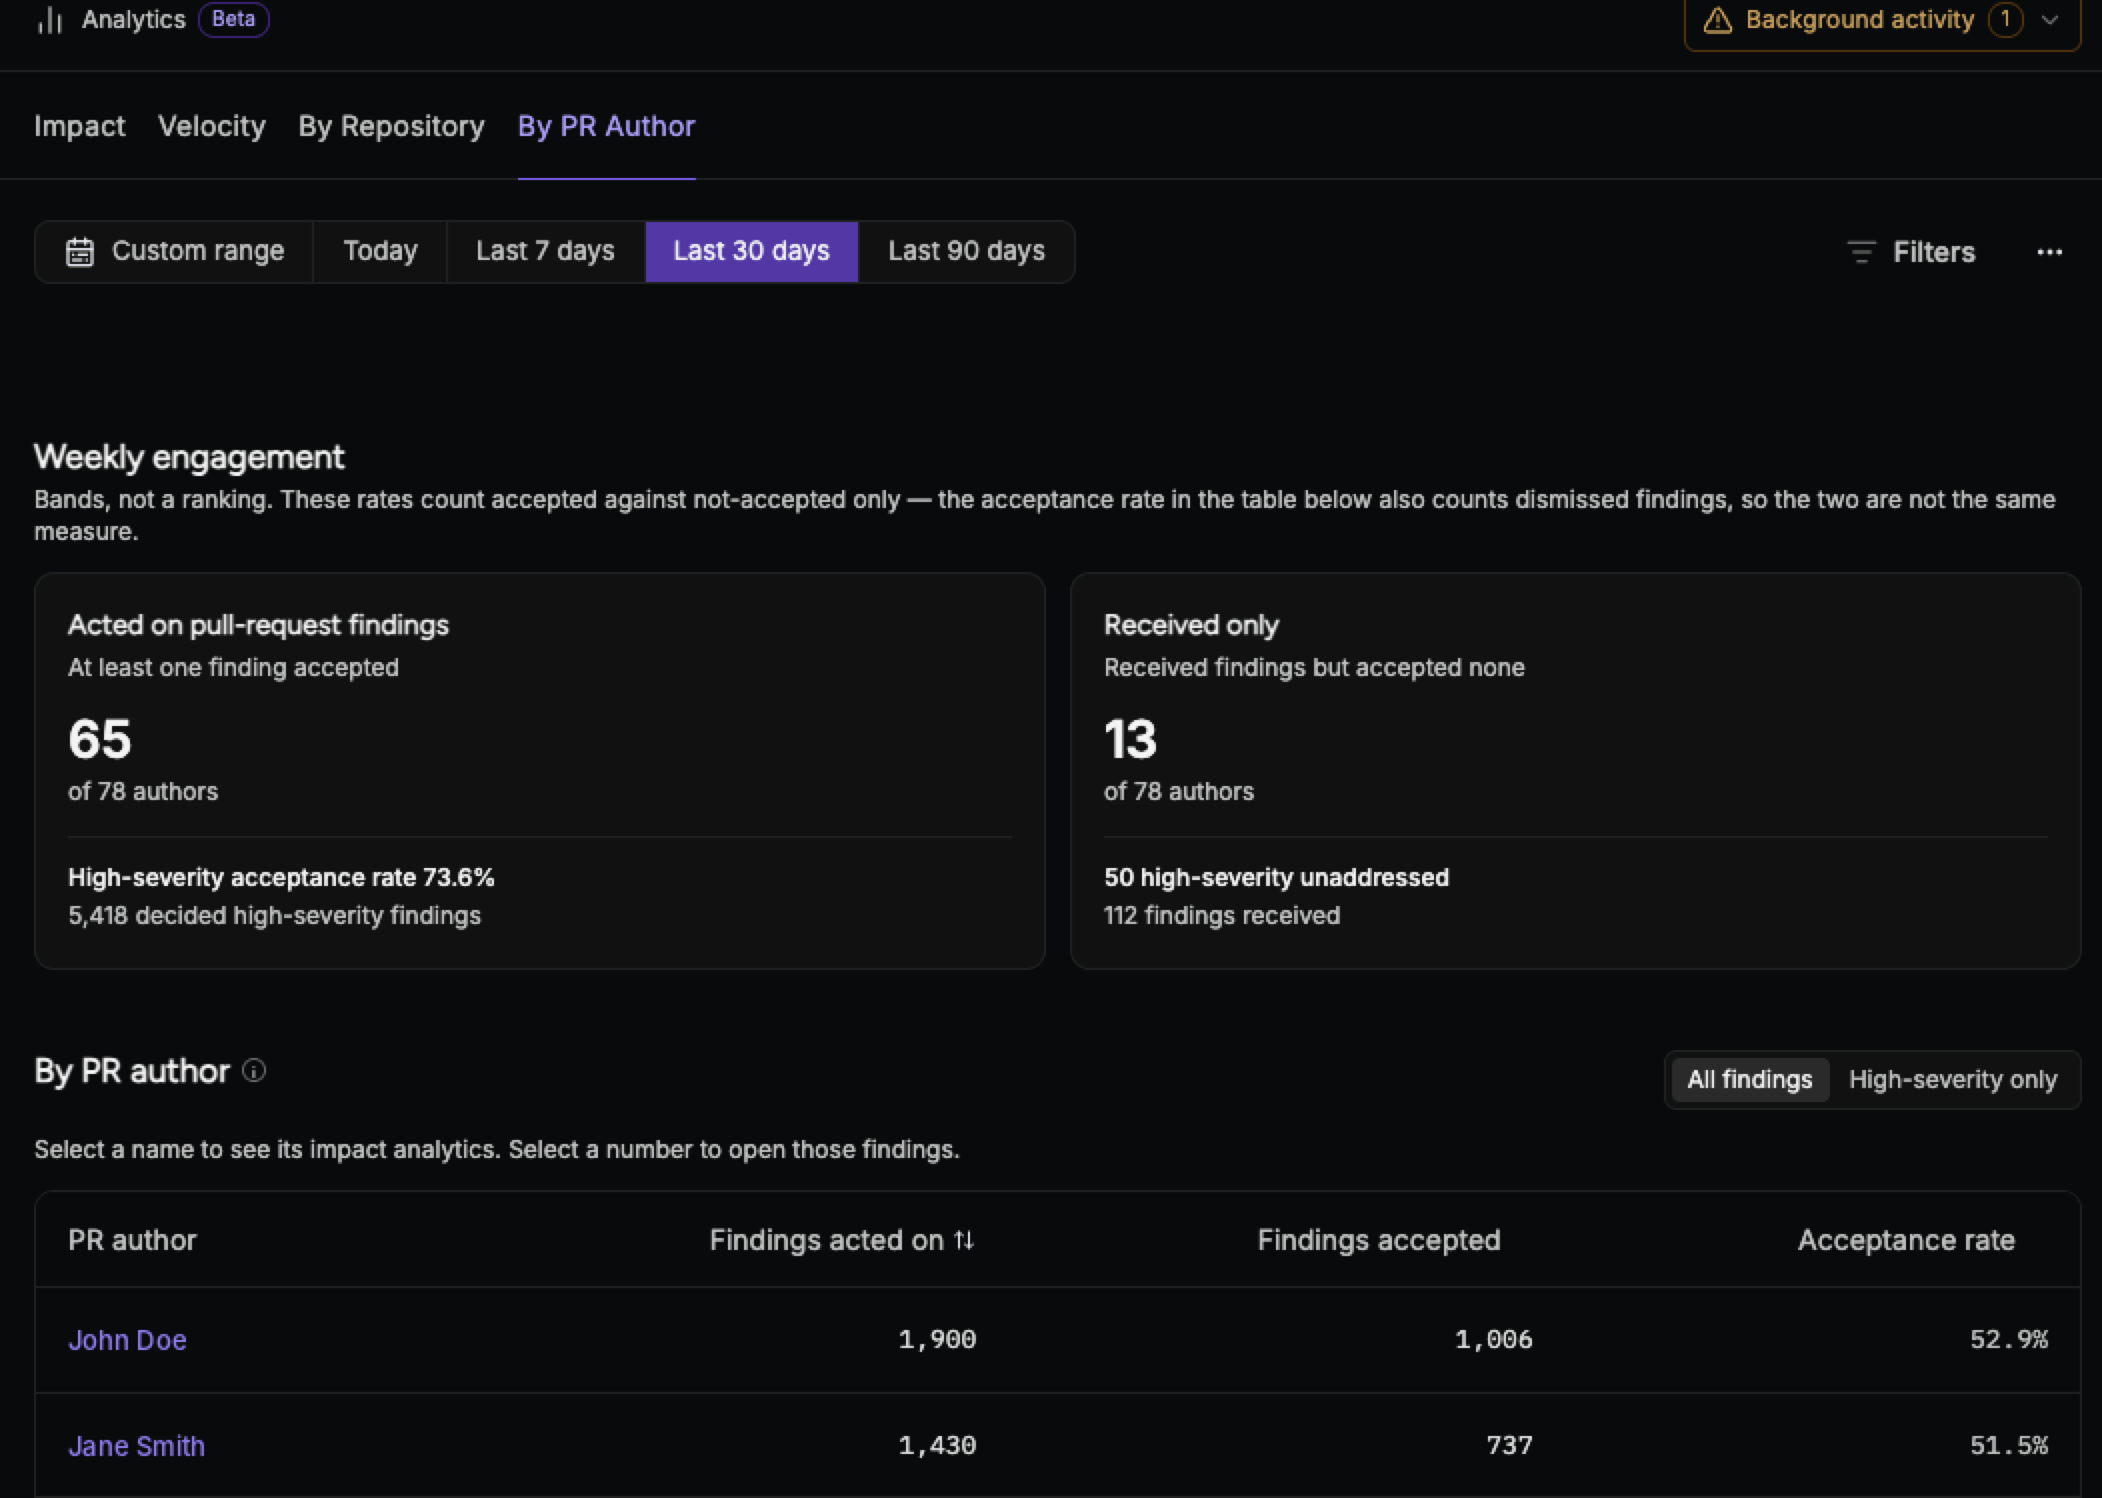
Weekly engagement
Track finding response across PR authors week by week. The view shows:- Acted on pull request findings: PR authors who accepted at least one finding.
- High-severity acceptance rate: The percentage of high-severity findings that resulted in an accepted code change.
- Received only: PR authors who received findings but accepted none.
- High-severity unaddressed: High-severity findings that were not addressed.
Author table
See finding activity and response for each PR author. The table includes:- PR author: The author of the pull requests where findings were raised.
- Findings acted on: The number of the author’s findings with a final outcome: accepted, not accepted, or dismissed.
- Findings accepted: The number of findings that resulted in an accepted code change.
- Acceptance rate: The percentage of the author’s findings that were accepted.
Export and share analytics
Use the ⋯ menu at the top of the dashboard to export or share your analytics.Export CSV
Download your findings as a CSV file namedfindings.csv for reporting, audits, or analysis in your own tools. Each row represents a single Qodo finding. The export includes up to 10,000 findings. It can also include outdated findings and findings detected after merge, which the dashboard excludes, so CSV totals may not match the dashboard.