> ## Documentation Index
> Fetch the complete documentation index at: https://docs.qodo.ai/llms.txt
> Use this file to discover all available pages before exploring further.
# Gain insight with Software Map
> Explore how your repositories connect, assess change impact, and monitor code review findings with Software Map.
Beta
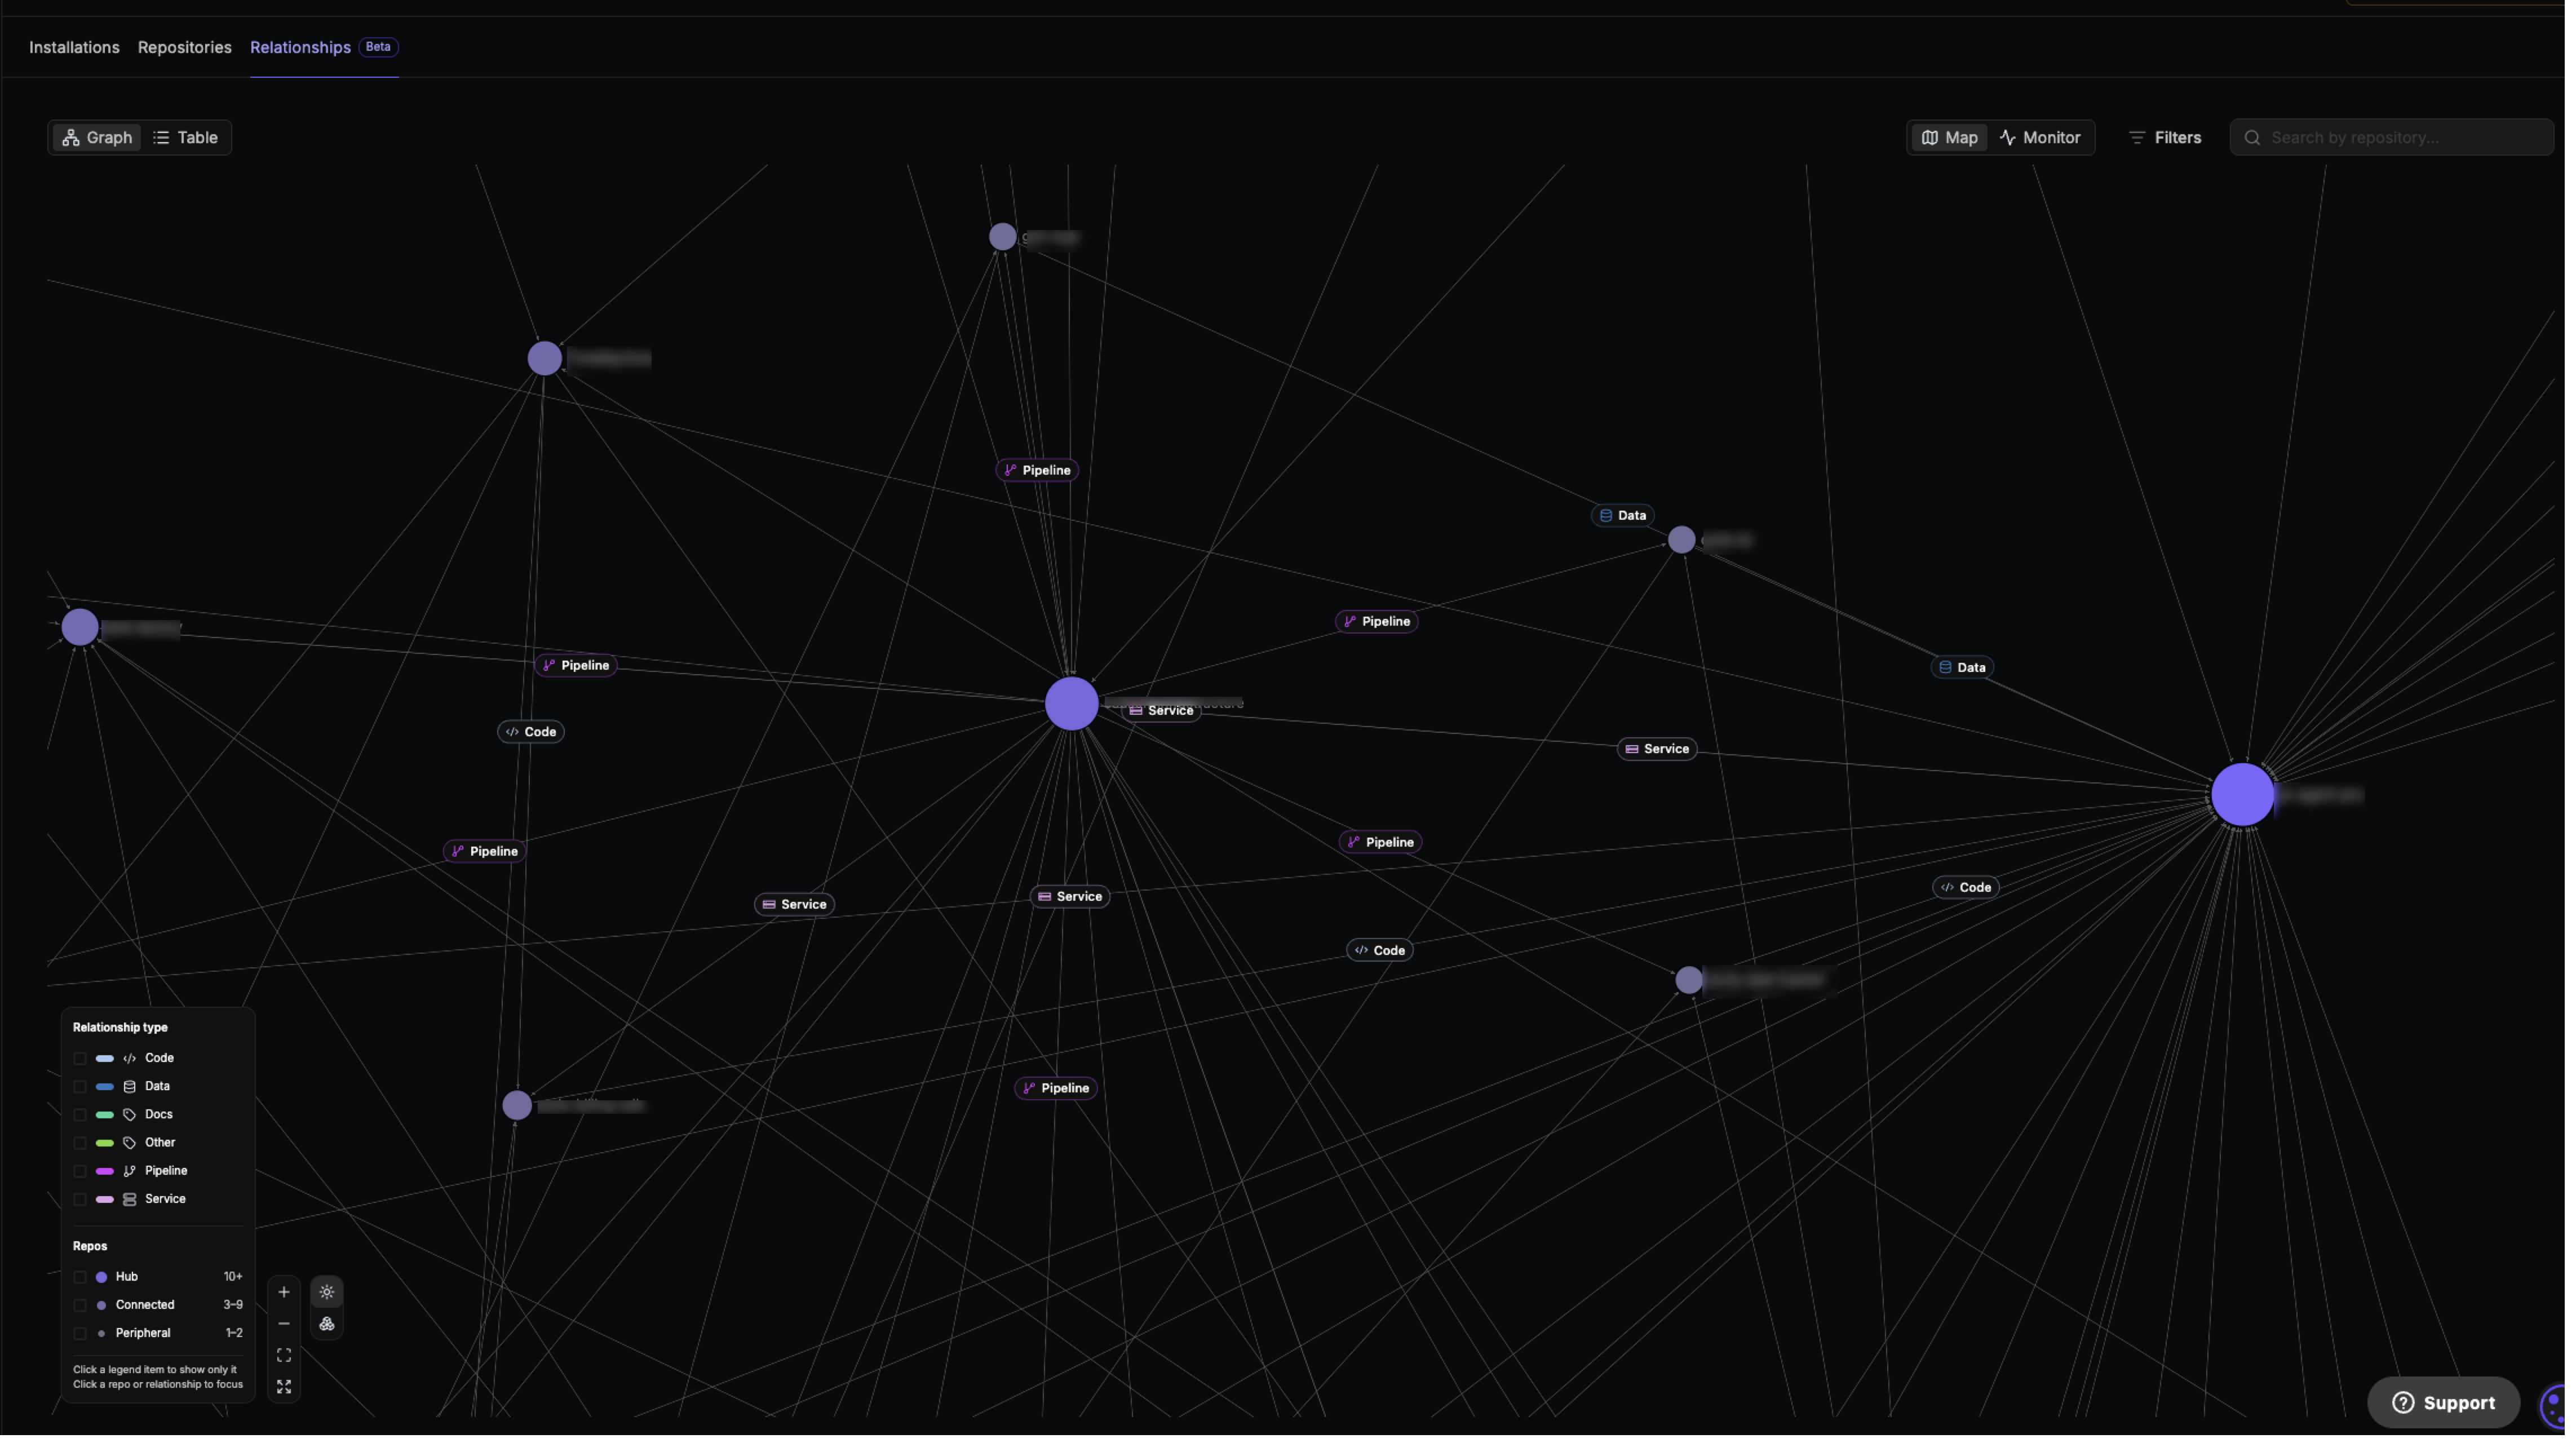
Software Map gives you a live view of your software system across repositories. Qodo automatically discovers your repositories and maps how they connect, helping you understand your system, assess the potential impact of changes, and identify where code review findings are concentrated.
The map updates as pull requests land, so it reflects your system as it changes without requiring you to create or maintain architecture diagrams.
For more background on Software Map, see [Introducing the Software Map in Qodo](https://www.qodo.ai/blog/introducing-qodos-software-map/).
 Use Software Map to:
* Understand how repositories connect and identify system hubs.
* See the potential impact of changes across downstream repositories.
* Follow service contracts to their consumers.
* Identify where code review findings are concentrated.
* Find repositories with unresolved findings.
* Give Qodo's agents system-level context when reviewing changes.
## Access the Software Map in the Qodo portal
1. Log in to the Qodo portal.
2. Select **Repositories** from the left navigation menu.
3. Select the **Relationships** tab.
4. Select the **Graph** tab.
## Understand your software system
Software Map shows how your repositories are connected and helps you identify the parts of your system that are central to other repositories.
The map shows:
* Repository connections through relationships such as Service, Pipeline, and Code.
* Highly connected repositories, peripheral repositories, and clusters of related repositories.
* Contracts between services and the repositories that consume them.
* Downstream dependents that may be affected by a change.
* Code review findings across your repository relationships.
Software Map works at the repository level, giving you a view of the system at the level where you work.
## Explore the repository relationships
Map view displays repositories as an interactive graph. Repositories are sized by connection tier and connected according to their relationship type.
Use the layout switcher to change how the graph is arranged:
| Layout | Description |
| ------------- | -------------------------------------------------------------------------------------------------------------------------------------------------- |
| Radial | The most connected repositories pull toward the center. |
| Grouped | Each cluster of related repositories gets its own area. |
| Busiest first | Repositories with the most pull requests carrying findings move to the center, while clusters keep their relationship-based direction. |
| Ranked disc | Repositories are evenly spread by pull requests carrying findings, with the busiest repositories at the center. This layout ignores relationships. |
Use the canvas controls to:
* Zoom in or out.
* Select **Fit view** to fit the entire graph to the screen.
* Select **Expand to fullscreen** to fill the screen with the graph.
### Narrow the map
Use the interactive map to focus on the parts of the system you want to examine. Scope the map to a team, filter to a service, or follow a service contract to its consumers.
## Assess change impact
Software Map helps you understand the potential impact of a change before you merge it.
View the downstream repositories that depend on a repository and follow service contracts to identify their consumers. This can help you determine the scope of review and testing for changes to shared services or APIs.
Qodo derives relationships and contracts from your code and updates the map as pull requests land. This keeps the map aligned with the current state of your system.
## Monitor code review findings
To view code review findings on the repository graph, select **Monitor** in the top-right corner of the graph.
Monitor view shows findings across related repositories. Use it to identify where findings are concentrated and where unresolved findings are accumulating.
Each repository is segmented to show its findings breakdown. The **Findings** panel lets you filter the findings displayed on the graph.
### Filter findings
Select a time range to control which findings are included:
* Today.
* Last 7 days.
* Last 30 days.
* Last 90 days.
Use the following filters:
| Control | Options |
| ------------ | ------------------------------------------- |
| **Group by** | Severity, Category |
| **Severity** | Low, Medium, High. Select any combination. |
| **PR state** | Open, Merged, Closed. Select one at a time. |
The Findings panel displays matching findings by status, including:
* **Shipped unfixed**.
* **Dismissed**.
* **Fixed before merge**.
Counts in the Findings panel represent findings, not repositories.
When a findings filter is active, the sidebar also shows how many repositories match the current selection.
## Keep the map current
There is nothing to configure or maintain. Qodo automatically discovers your repositories and builds the map.
The initial build can take a few hours while Qodo analyzes the system. After the initial build, Qodo re-derives the map as pull requests land, keeping the relationships and contracts aligned with changes in the code.
Use Software Map to:
* Understand how repositories connect and identify system hubs.
* See the potential impact of changes across downstream repositories.
* Follow service contracts to their consumers.
* Identify where code review findings are concentrated.
* Find repositories with unresolved findings.
* Give Qodo's agents system-level context when reviewing changes.
## Access the Software Map in the Qodo portal
1. Log in to the Qodo portal.
2. Select **Repositories** from the left navigation menu.
3. Select the **Relationships** tab.
4. Select the **Graph** tab.
## Understand your software system
Software Map shows how your repositories are connected and helps you identify the parts of your system that are central to other repositories.
The map shows:
* Repository connections through relationships such as Service, Pipeline, and Code.
* Highly connected repositories, peripheral repositories, and clusters of related repositories.
* Contracts between services and the repositories that consume them.
* Downstream dependents that may be affected by a change.
* Code review findings across your repository relationships.
Software Map works at the repository level, giving you a view of the system at the level where you work.
## Explore the repository relationships
Map view displays repositories as an interactive graph. Repositories are sized by connection tier and connected according to their relationship type.
Use the layout switcher to change how the graph is arranged:
| Layout | Description |
| ------------- | -------------------------------------------------------------------------------------------------------------------------------------------------- |
| Radial | The most connected repositories pull toward the center. |
| Grouped | Each cluster of related repositories gets its own area. |
| Busiest first | Repositories with the most pull requests carrying findings move to the center, while clusters keep their relationship-based direction. |
| Ranked disc | Repositories are evenly spread by pull requests carrying findings, with the busiest repositories at the center. This layout ignores relationships. |
Use the canvas controls to:
* Zoom in or out.
* Select **Fit view** to fit the entire graph to the screen.
* Select **Expand to fullscreen** to fill the screen with the graph.
### Narrow the map
Use the interactive map to focus on the parts of the system you want to examine. Scope the map to a team, filter to a service, or follow a service contract to its consumers.
## Assess change impact
Software Map helps you understand the potential impact of a change before you merge it.
View the downstream repositories that depend on a repository and follow service contracts to identify their consumers. This can help you determine the scope of review and testing for changes to shared services or APIs.
Qodo derives relationships and contracts from your code and updates the map as pull requests land. This keeps the map aligned with the current state of your system.
## Monitor code review findings
To view code review findings on the repository graph, select **Monitor** in the top-right corner of the graph.
Monitor view shows findings across related repositories. Use it to identify where findings are concentrated and where unresolved findings are accumulating.
Each repository is segmented to show its findings breakdown. The **Findings** panel lets you filter the findings displayed on the graph.
### Filter findings
Select a time range to control which findings are included:
* Today.
* Last 7 days.
* Last 30 days.
* Last 90 days.
Use the following filters:
| Control | Options |
| ------------ | ------------------------------------------- |
| **Group by** | Severity, Category |
| **Severity** | Low, Medium, High. Select any combination. |
| **PR state** | Open, Merged, Closed. Select one at a time. |
The Findings panel displays matching findings by status, including:
* **Shipped unfixed**.
* **Dismissed**.
* **Fixed before merge**.
Counts in the Findings panel represent findings, not repositories.
When a findings filter is active, the sidebar also shows how many repositories match the current selection.
## Keep the map current
There is nothing to configure or maintain. Qodo automatically discovers your repositories and builds the map.
The initial build can take a few hours while Qodo analyzes the system. After the initial build, Qodo re-derives the map as pull requests land, keeping the relationships and contracts aligned with changes in the code.